
I will be the first to admit that I have trust issues. I blame it on my father who could totally build me a hovercraft out of a lawnmower and repeatedly told me he couldn’t. Regardless, “Trust but verify” has been near and dear to my heart, and not just in RF coverage situations.
Let’s take a tool that I use frequently, Ekahau Site Survey (ESS). I really enjoy ekahau’s stability and flexibility. But one thing that pops up occasionally is that the antenna patterns don’t always match actual product. Now ekahau doesn’t test antennas, they rely on the antenna manufacturers to provide antenna patterns. And all of this involves people building a antenna patterns to put into the tool. Sometimes things don’t always work out.
Recently I was helping a coworker prepare for a survey, and he mentioned that the Meraki ANT-3-E antenna was so narrow that it would barely cover 2 desks. Immediately I thought that something was off. Was it the wrong antenna? Did he forget to scale the floorplan? Is the height set super low? Was the AP set to 1db of transmit power?
It’s not that I didn’t trust my coworker, it was more of a “I need to verify what he is telling me and find where things are going wrong.” Mistakes happen, and I wanted to see what the cause of this was. Verifying in ESS, I confirmed what he was telling me. Sure enough, it barely covered 2 desks, with the correct height and power. “That’s odd,” I thought to myself.
So how did I go about verifying what was going on? First I compared it to another antenna that I know well. The Cisco 2566D. This should be a similar pattern as both are a 60×60 antennas. Holy Delta batman. Not even close.

That’s odd, let’s compare it to the Cisco 2513 stadium antenna. Still, the Meraki ANT-3-E was dramatically smaller and tighter.

Further, I compared it to the Meraki ANT-3-F, their “narrower” patch antenna. Still a tighter coverage pattern. Also note how much tighter the CCI is on this antenna (antennas separated further in order to show this).

This antenna pattern fails my verification. At this point, I would suggest not using this antenna as it stands today. The next step for me would be to do an APoaS survey and verify the coverage pattern before trusting this antenna.
Note, both ekahau and Meraki have been notified of the issue. It doesn’t mean the antenna is bad, it doesn’t mean Ekahau ESS doesn’t work properly, I just means that this antenna pattern isn’t representative of what we expect. Maybe our expectations are wrong (I doubt this).
This leads me to a larger topic that I like when building wireless networks. What mechanisms are built into my tools and processes to ensure that the work is verifiable?
In my previous job, I had sent an engineer to do an APoaS survey at a customer site in preparation for a predictive design. He came back and had created a predictive model for a design I had ballparked this design at around 35 APs, just based on their requirements and a typical office building construction.
The engineer had come back with a design that had 57 APs. Wow, those must be some dense walls. “Can you show me your APoaS data,” I asked him.
One APoaS location was located in an office at the end of a row of offices. I looked at the RSSI from that placement and found that the -67 cell edge cutoff 6 rooms from where the AP was placed.
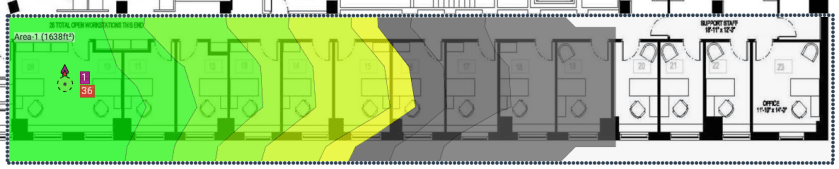
When I looked at his predictive model, I put a predictive AP of the same model, in the same location, with the same channel and power settings. In his model, the -67 cell edge cut off 2 rooms away from where the AP was placed.

In reality, somewhere he had take a wall attenuation measurement, that was incorrect and based his wall densities off that erroneously high value. Now if he had not done the APoaS survey, I would have had no way to prove that his wall attenuation values were incorrect. It’s also entirely possible that his transmit power on the survey AP was off. Luckily we could validate those things and find that the values were abnormally high.
Without the ability to validate this info, the customer would have purchased, installed and then been forced to troubleshoot way too many APs.
There are very few scenarios where as a wireless engineer having data is a bad thing. Data enables you to validate you assumptions and sanity check that things “make sense” within context. Finding opportunities to check what you think vs what the data shows will help you learn, adapt and grow your skills as a wireless engineer.

Jake, definitely a valuable lesson here. We use a slightly different toolset (iBwave Design Enterprise with the Wi-Fi module), and again we’re relying on the pattern file provided by the vendor to our RF design engineers.
But our approach to new antenna (and coverage) validation is a little different than what most of the Wi-Fi world does:
• We take a sample of the antenna and validate the pattern provided by the vendor by connecting it to a CW generator (a calibrated signal source), and perform a survey using Anite (now Keysight) Nemo with an attached PCTEL scanner.
• This validation is performed in an open field, and at different frequencies depending on what the antenna supports
We then plot the data and compare to the pattern provided by the vendor. I realize that this isn’t an option for people that use APs with internal antennas.
What we’ve found is that the pattern files can sometime be off, but that polar plot in the data sheet is far more likely to be off than the pattern file.
No matter the approach: over-the-air testing is key.
Also found that making sure that your test AP model and H/W revision is identical identical to what you intend to deploy — and that it’s running the same firmware you intend to go-live with. Don’t know how many times I’ve seen Tx calibration table “bugs” listed in firmware changelogs, bugs that tend to mean your AP is putting out less power than it should.
As for variances in the ACTUAL Tx power between identical model APs…. don’t even get me started there. I always add a dB or two to the body-loss value to compensate for this. But, I like to be very conservative with design.
LikeLike
If I get what you are saying, you find the antenna plots given by the mfg to be less accurate than the models in iBwave? Maybe I need to talk to them about how they do their models.
My understanding is that their models are derived from the mfg antenna patterns. Maybe I’m off on that.
LikeLike
This is why experience is so incredibly valuable – to be able to quickly see when a generally trusted tool or setup is giving spurious results.
Personally I think predictive “surveys” have value mostly for pre-sales ROM costings. If done post sale, then they can be used to help an engineer get a feel for a site… although this does burn money which might just be better used on site taking attenuation readings/etc.
I think Ekahau tends to be pessimistic with it’s predictive – generally, especailly compared to APoS readings taken with their adapters. This does help do two things:-
1) it helps Ekahau cover themselves – you won’t do predictive surveys and have people shouting that the validation surveys had lots of coverage holes. measured coverage will likely be much better than predicted… and the map will still be green.
2) it helps to cater for poor client devices – these things will probably see -67 too, even though they’re 5/10 dB lower than an SA-1 adapter.
LikeLike